reconcile your monthly utility account with our data. This is your utility policeman
Measures ACTIVE and REACTIVE energy for each phase
single phase or 3-phase, 250V
Current clamps of 80A to 1200A
powered by a small UPS
stores data on a local SD card, no internet access required for data storage
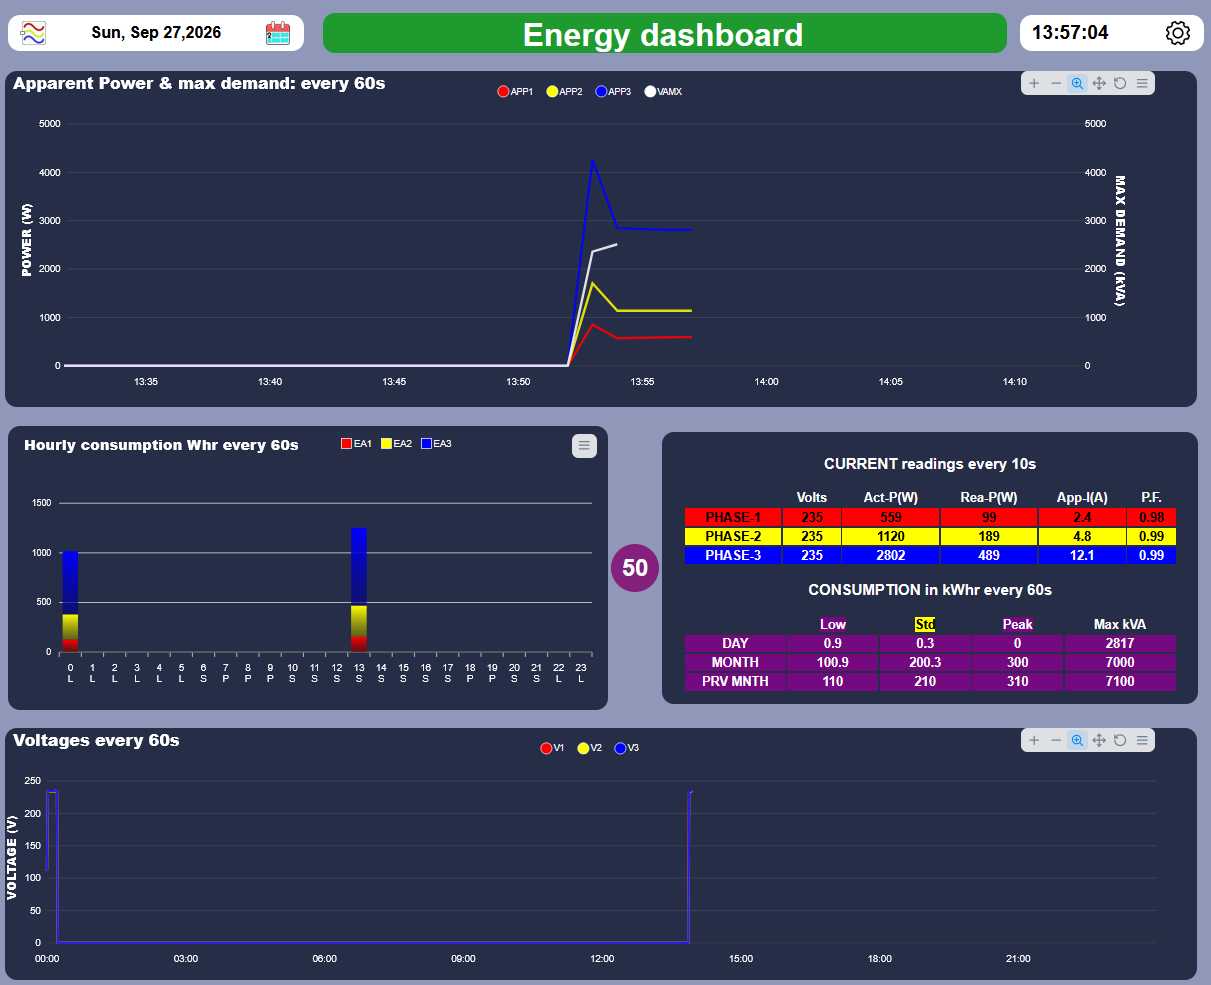
Top: Apparant power for each of the 3 phases over a 24hr period
Bot left: Histogram summary for each hour of the day, also showing applicable tariff
Bot right: Shows instand active and reactive power updated every 10s
consumption in kWhr for each tariff category for current month
consumption in kWhr for each tariff category for previous month
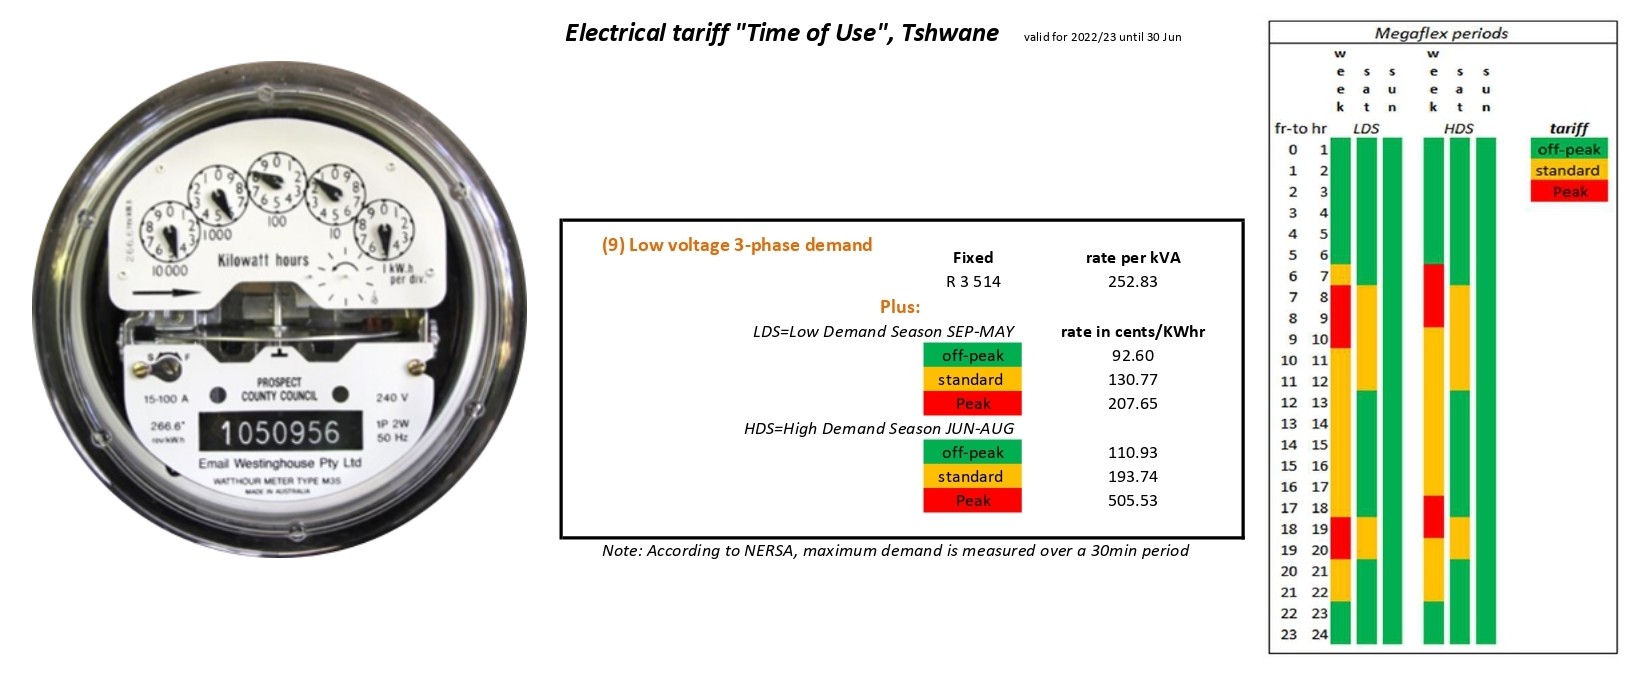
Conventional meters don't record the tariff structures imposed by NERSA
Low, Standard and Peak tariff hours for the day
The hours change during 3 months of the year
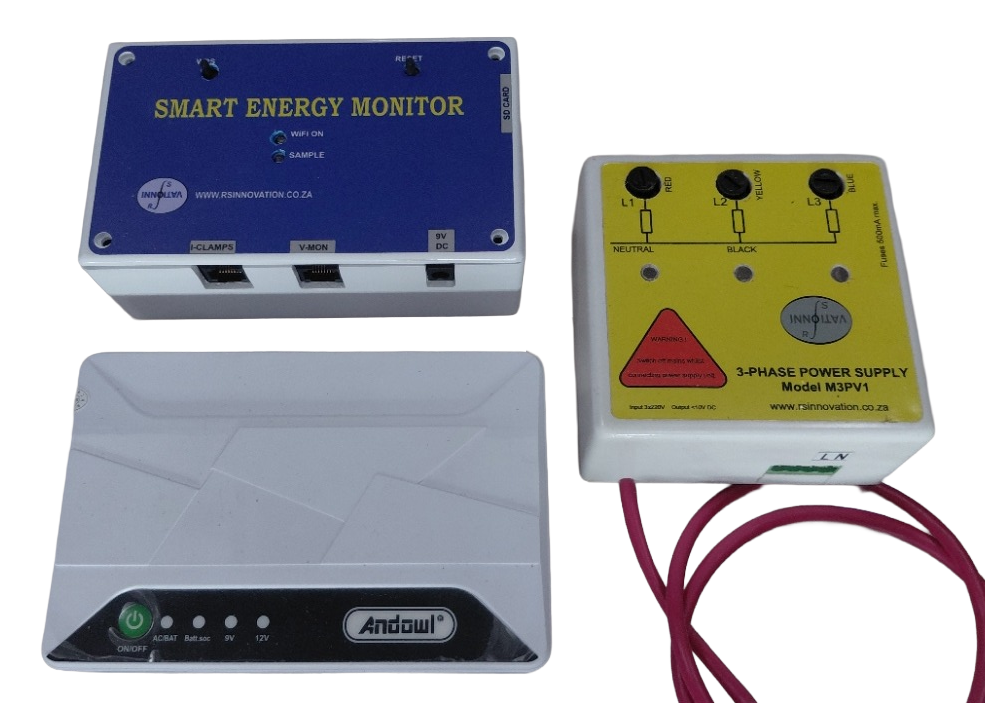
Transformer isolated voltage sensing supply
Smart Energy Monitor connected to your WiFi network
small UPS
View the current sensing coils on a seperate page